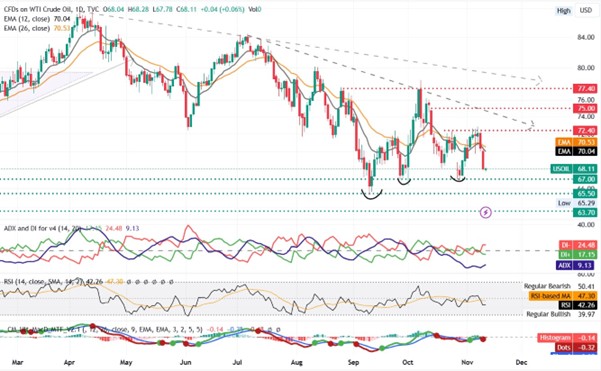
Crude trades somewhat steadily near the $68 per barrel area in today’s session, after losing approximately 5% in over two sessions, however, pessimism around the demand growth of the commodity remains moderately high. This report aims at analysing the fundamental drivers influencing Oil’s price action and seeks to assess its future outlook and conclude with a technical analysis.

Trump’s energy plans under his presidency
As the newly elected president of the United States, Donald Trump spared no moment signalling his strong support for increasing domestic oil and gas production but also his plans to elevate the US further higher on the podium of the largest oil exporting nations of the globe scene.
His pro-drilling approach aims to boost oil production, which could benefit the fossil fuel industry overall, given his intents at loosening up regulations (allow drilling on federal lands) and making easier for companies obtain drilling leases and licences. The reasonable expectation given this fossil-fuel energy friendliness from the now 47th president of the US and his goal to supercharge US oil and gas production to fresh record highs, is for crude’s price to devalue significantly, since such plans would most likely lead to oversupplying the international market.
Furthermore, his hardliner stance on China, alongside the imposed tariffs on Chinese goods, could on the other side of the equation, cap demand of goods from the Red Dragon, which could deplete further the oil needs of the world’s largest oil consumer.
OPEC lowers global oil forecasts yet again
In its latest monthly report, OPEC revised lower its oil demand growth projections for 2025, marking their 4th consecutive month of downward revisions, as worries surrounding Chinese demand and consumption for oil, remain elevated.
Projections for reduced oil demand from the world’s largest oil-thirsty nation primarily stem from the lack of sufficient stimulus measures from authorities, to revive pent up demand, but also from persistent deflationary waves.
The negative effect from projections of a wider Middle East conflict have been neutralized so far, as the war scope of the war has been generally contained, yet the cartel continues stills to flag the developments as a possible disturbance of their assessments onwards.
Oil Technical Analysis
WTI Cash Daily

- Support : 67.00 (S1); 65.50 (S2); 63.70 (S3);
- Resistance: 72.40 (R1); 75.00 (R2); 77.40 (R3);
Looking at WTI Daily chart we observe that the lack of demand puts pressure on the commodity, not allowing it to form higher high and instead bears remain still in control, dragging it price lower.
Albeit the commodity’s downward trajectory, validated by the descending trendline incepted since the start of July and the formation of a higher low earlier this month, we have reasons to believe that crude will have trouble breaking swiftly below the $65-67 support area.
Hence, we cautiously adopt a sideways bias for the commodity, awaiting to see whether the bears’ next wave will be strong enough to drag the prices into an area last seen before in May of 2023.
Supporting our case for a sideways assessment is an RSI reading that fluctuates around the 50 area, signalling indecision, but also a depressed ADX value of 9, which showcases dry-up of volatility and lack of momentum. Furthermore, both MACD and the signal line flattened near the threshold line, with the latest two crossovers cancelling each others’ potency given the lack of strength by both the bulls and the bears.
Shall the bears remain in control and find enough resolve in their conviction, we could reasonably expect to see WTI challenging and breaking the $67.00 (S1) area and then go on to challenge the $65.50 (S2) support base.
Should on the other hand, the bulls take over, we may see WTI rebound and head on to break the $72.40 (R1) ceiling. Should enough bullish momentum occur, we may see the challenging of the $75.00 (R2) resistance barrier.
免责声明: This material is for general informational & educational purposes only and should not be considered as investment advice or an investment recommendation. T4Trade is not responsible for any data provided by third parties referenced or hyperlinked, in this communication.


