Last week’s CPI update, allowed market participants to take a breather and exhale with relief, as inflation in the US failed to accelerate for another month and instead recorded a trivial fall, solidifying at the same time the odds for two rate reductions by the Fed near the end of the year. Is the Fed ready to slash rates however? In this Gold report we aim to shed light on the catalysts driving the precious metal’s price, assess its future outlook and conclude with a technical analysis.

Plethora of bullish catalysts lifts safe haven assets
A combination of various bullish underlying factors guides still the direction of the precious metal towards new historic highs, polishing the shine of the yellow metal in the eyes of international investors.
Some catalysts include, the revamped purchases of physical gold from central banks, the probabilities for an overspill of geopolitical tensions into nearby regions, the state of bond markets, but also the good old-fashioned monetary policy decisions of major central banks. This Gold report will deal more with the latter factor, rather than the former, and more precisely, a review will be made in regards to the latest news releases that inherently impact the decisions of those in charge of deploying monetary policy.
The primary concern of central banks is to ensure price stability in the economy they are in charge of, hence keeping up with inflation updates but also draw forecasts of where they may be heading in the short-medium horizon, allows policymakers to take better and more appropriate policy decisions.
Cooler inflation reignites rate cut optimism
The latest inflation update came last week, and market participants embraced the outcome with optimism, projecting that the Federal Reserve policymakers will see this piece of data as another reason to start considering a pivot toward looser financial conditions in 2024.
More specifically, both the headline and Core CPI rates matched wider market expectations for a marginal cooldown, to the 3.4% and 3.6% levels respectively and money market participants took a long and deep breather, not because inflationary pressures eased much, but because they failed to accelerate, giving them confidence that the Fed may in fact go for two rate cuts in the last quarter of this year.
In parallel to the CPI print, the latest retail sales report was also released, which added another dimension to the days of traders. Consumer spending stalled in April according to the latest retail sales report, which may be a perceived as an indirect signal to central bank officials that the restrictive practices could be abandoned and easing measures shall follow.
The combination of a cooler inflation print and a stagnated retail sales rate, amplified the flow of funds into safe-haven assets such as gold and silver, polishing their appeal.
But taking a step back and looking at the trend from a broader perspective, the results indicate that inflation is having much harder time to cool than what the market originally anticipated, showcasing its stickier nature, and given its trajectory, it indirectly validates various Fed policymakers’ cautious stance that oppose a premature policy pivot, hence the commentary from officials throughout the week will be monitored carefully. So far this week, a reserved stance was adopted by speakers.
Also of critical importance will be the contents of the latest meeting minutes of the FOMC, as it will allow traders to see what has been stated during the last decision, in hopes of finding clues to what may happen next. Currently in money markets the odds are in favour for a 25-basis point rate at the September meeting and another cut of equal magnitude at the December meeting has amassed more confidence in the eyes of polled economists after the CPI print, and now a total of 50bps is expected to be shed before years end. Overall, should further incoming data favour additional rate reductions, the precious is reasonably expected to gain further ground, since the prospect of looser financial conditions polishes the appeal of the safe haven asset.

Gold Technical Analysis
XAUUSD H4 Chart
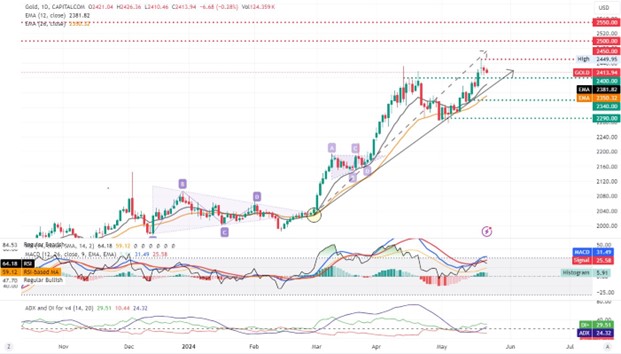
- Support: 2400 (S1), 2340 (S2), 2290 (S3)
- Resistance: 2450 (R1), 2500 (R2), 2550 (R3)
Looking at XAUUSD Daily Chart we observe the precious retracing its steps after hitting fresh record highs and now is attempting to form a base round and about the prior former high point. We hold a bullish outlook bias for the commodity given the current bullish sentiment that propels it to higher ground.
Supporting our case it the fact that the price action has managed to consolidate and rise above both the 12 and 26 period moving averages, leaving at the same time the ascending trendline, incepted since March partly intact. In regards to the strength of the move, the RSI indicator below our chart registers currently a value of 64, highlighting that the bulls are in control and are eager to push the precious to higher ground. Furthermore, the MACD line has crossed above the Signal line, withing the past week, signifying the end of the short-term pullback and the handoff the initiative from the bears to the bulls.
The +DI is one and a half times larger than the -DI, pointing towards stronger buying interest rather than selling and the ADX is once again on the rise. Should, the bulls stay on top and hold onto the initiative, we may see the precious recuperating yesterday’s losses, break past the $2450 (R1) record high and head for the $2500 (R2) hypothetical resistance barrier. Should on the other hand, the bears find enough resolve and pile in short positions, we may see the definitive break below the $2400 (S1) former all time high spot which now acts as support and head for the $2340 (S2) support base.
免责声明: This material is for general informational & educational purposes only and should not be considered as investment advice or an investment recommendation. T4Trade is not responsible for any data provided by third parties referenced or hyperlinked, in this communication.