
Chinese equities have quickly arisen from their yearslong slumber during February of 2024, as the government went all out and deployed numerous stimulus measures, seeking to restore stability in capital markets and create the necessary desirable conditions for international investors to allocate capital. In this equities report we aim to present and analyse the latest fundamental drivers and economic developments could impact the performance of Chinese equities and conclude with a technical analysis of CN50 index.
Equities report
PBoC leaves 1-year MLF unchanged
Earlier today, the People’s Bank of China decided to keep its 1-year medium lending facility (MLF) rate unchanged at the 2.5% level and disappointed a small portion of market participants who bet that the central bank will loosen up further its stance to aid a faltering domestic demand, but also stabilize the Yuan. The central bank judged that the current level of the 1-year MLF rate, which acts as a credit chokehold for financial institutions, is appropriate enough for the time being and has the potential to reignite consumption in due time.
Nevertheless, today’s ‘pause’, alongside the absence of a fresh capital injection and an additional stimulus package into the banking system, made some investors wary. Earlier this week, China has reportedly kicked off plans to sell $140 billion worth of long-dated bonds aimed at stimulating the economy, which is a factor that may have contributed to the observed subdued reactions. Stocks in mainland China headed south post the decision, extending their losing streak and traversed further away from 8-month highs, yet bullish momentum and buying interest maintain their potency, softening the blow.
US-China trade wars enter second phase
Earlier this week, the Biden administration finalized their plans that aim to contain China’s growing exporting trade superiority by introducing new tariffs on imported goods and materials. The tariffs target specifically imports from goods manufactured in China, such as electric vehicles and solar power components, but also steel and aluminum, semiconductors and key minerals, which are expected to be affected indirectly as well.
The new import tariffs for Chinese electric vehicles that enter the US market, have now quadrupled (100%) in value and almost doubled for solar components (50%). China evidently has a clear advantage on the EV manufacturing function, due to its strategic acquisitions and deals with nations, who are abundant with the necessary raw materials needed for manufacturing (i.e. cobalt and lithium) and that is precisely what the US sees as threatening, hence the tariffs were put in place to safeguard and protect domestic producers and keep them longer in the game.
Even though, tariffs seek to level out the playground from the US point of view, China perceives this act as another blow to their existing deteriorating trade relationships and runs the risk of pushing the nations into a full blown economic and trade war.
At the end of the day, other US allied nations may follow suit and adopt the same stance against China, (see Europe) which aggravates the risk for a fragmentation of trading relations, giving rise to economic “factions”, which could ultimately jeopardize the stability and soundness of the global financial hegemony, resulting in a multipolar trading system.
Evidently, the President of the European Commission, Von Der Leyen, broadcasted recently that the bloc is worried about a flood of electric vehicles and steel from China, which could displace cherished industries and jobs in Europe and that the union, is in response, considering imposing tariffs to offset the subsidies that have assisted the growth of the Red Dragon’s industry.
China quickly responded to the US administration, by vowing that ‘resolute measures’ will be undertaken on the back of Biden’s new policy and some analysts started to project that the exchanges between the two will only get harsher going into 2025.
Equities Phân tích kỹ thuật
CN50 Daily Chart
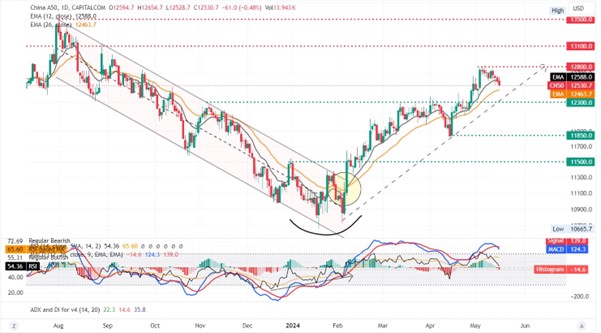
- Support: 12300 (S1), 11850 (S2), 11500 (S3)
- Resistance: 12800 (R1), 13100 (R2), 13500 (R3)
Looking at CN50 Daily chart we observe the index resurging strongly from its 5-year low pit early in February and since then, scaling effortlessly higher, to an area last visited in November of 2023, amassing an impressive 18% gain. We hold a bullish outlook bias for the index, as long as the price action remains above the ascending trendline incepted since the start of February and forms a higher low near and above the S1 level.
Currently, technical indicators give early signs that the current pullback may deepen, evident from the crossover of the MACD below the signal line in addition to the RSI value which aims to crack below the 50 threshold, however these indications are currently not enough for us to switch our assessment from bullish to bearish.
Should the bulls maintain the helm, we may see the index breaking past the 12800 (R1) level and head for the 13100 (R2) resistance barrier. Should on the other hand, selling pressure aggravate and the bear gain control, we may see the break below ascending trendline and the S1 support base, with the price action traversing closer to the 11850 (S2) support area.
Disclaimer: This material is for general informational & educational purposes only and should not be considered investment advice or an investment recommendation. T4Trade is not responsible for any data provided by third parties referenced or hyperlinked, in this communication.