Technical indicators are used by traders to identify potential trading opportunities in the financial market. They provide vital insights into when to open or exit positions by analysing the price movement of assets to detect patterns or trends.
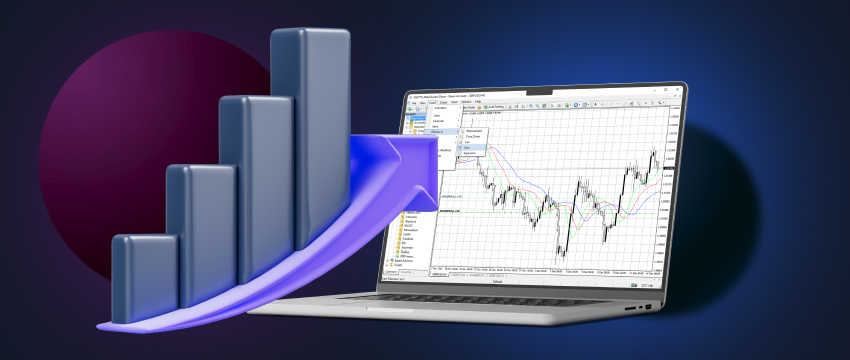
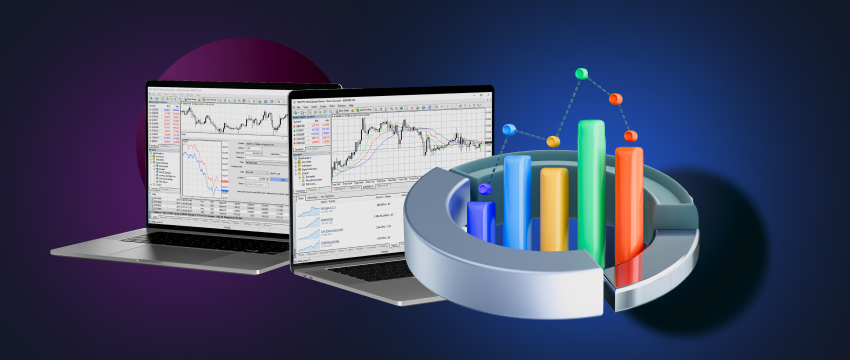
Trading platforms like the MetaTrader 4 (MT4) offer millions of global traders more than 30 built-in indicators, 2000 free custom indicators and 700 paid ones. This gives traders the ability to analyse the market, regardless of complexity. These indicators use mathematical formulas to forecast price changes and the direction that an asset is moving. The data can be viewed as visual representations of the market, e.g., charts, graphs, symbols, colours, etc.

How are technical indicators classified?
Technical indicators can be classified into two groups based on their functions: leading indicators and lagging indicators. Leading indicators (e.g., Stochastic, MACD, RSI, etc) usually use a shorter length of time to predict price, which leads the price movement. They measure how overbought or oversold an asset is. Lagging indicators (e.g., Moving Average) delivers a signal only once a trend or reversal has begun, without prewarning. They inform the trader of what prices are doing (moving up or down) so that they can make trading decisions.
Categories of technical indicators
Technical indicators can typically be categorised into trend following, momentum, volatility, and volume. In this series 1 article, we’ll take a closer look at trend following and momentum indicators, what they are and what they do.
Trend following indicators
Traders use trend-following indicators to trade currency pairs that are trending in either direction (up or down). They help to identify whether a trend exists and in what direction it’s headed. Trend-following indicators typically use some kind of price averaging to measure a trend’s strength and direction. A bullish trend is one when a price moves above the average whereas a bearish trend is when the price drops under the average. Different types of trend-following indicators include Moving Average (MA) Indicator, Moving Average Convergence / Divergence (MACD) indicator and Parabolic SAR (Stop and Reverse).

Moving-average indicator
Moving average indicators are used to identify price trends in the market by averaging price data over a period. Historic prices are used as a reference to identify the direction of the trend. Different periods of time may be used to measure moving averages. A rising moving average suggests that a particular instrument is in an uptrend. A falling moving average suggests that security is in a downtrend. Simple Moving Average (SMA) and Exponential Moving Average (EMA) are two types of moving average indicators. They differ in the way they weigh data points over time. SMA averages price data over a period, assigning each price equal weight, whereas EMA gives more weight to recent prices. As a result, EMA is more responsive to price changes than SMA.
Moving Average Convergence / Divergence (MACD)
The MACD indicator is used to trade trends. Its function is to chart the distance (the difference) between two price moving averages. The MACD also helps to identify whether a bullish or bearish price momentum is getting stronger or declining. The MACD is considered effective in wide-swinging trading markets. Three ways to use this technical indicator are crossover, divergences, or as an overbought/oversold indicator.
Parabolic SAR (Stop and Reverse)
Parabolic SAR is used as a technical indicator to identify possible trend reversals, following prices as they rise or fall. It does this using a trailing stop level. On a chart, the stop level takes on the shape of a parabolic curve.
Momentum indicators
Momentum indicators are used to measure the strength or weakness of stock prices, comparing a current price to what it was in the past. It measures the rate of change instead of actual price changes. If the most current price of a security is lower than what it was in the past, the momentum indicator is said to be negative. If the recent price of the security is higher, the momentum indicator is considered positive. If the momentum indicator has a value that exceeds zero, prices are predicted to rise. If the value falls below zero, prices are speculated to drop. Types of momentum indicators include Stochastic Oscillator, Commodity Channel Index (CCI) and Relative Strength Index (RSI).
Stochastic Oscillator
The Stochastic Oscillator shows the location of the closing price relative to the high-low range over certain periods (ranging from 0 – 100). In an uptrend, the price is said to close near the high and in a downtrend, the price closes near the low.
Commodity Channel Index (CCI)
This technical indicator measures the current price level relative to an average price level over particular periods of time. It is also used to identify overbought and oversold levels.
Relative Strength Index (RSI)
The RSI measures the strength or weakness of a currency pair by comparing the direction of its movements (up vs down) over a specific period. It does this by measuring recent losses or gains (price) against current prices.
Open a demo account to practise technical analysis.
Opening a demo trading offers a convenient way to practise using different technical indicators to maximise profits, regardless of skill or expertise. A demo trading account provides a virtual trading environment for you to practice your trades, without risking your own capital. It can be used to learn the intricacies of technical indicators before placing live trades. A demo account also provides the market conditions to test a variety of trading strategies and measures potential outcomes. Using a demo trading account through a broker like T4Trade also gives you access to current market insights so you can be informed of any new trends, volatilities or fluctuations.

Trading with T4Trade
T4Trade is a powerful global broker that is widely recognised for its expertise in trading and high-quality customer support. T4Trade’s MT4 platform offers almost all the trading tools needed to become a more strategic trader. The T4Trade Academy comprises innovative webinars, videos-on-demand, and podcasts, delivering useful trading tips and market insights to boost your knowledge. Informative blogs and FAQ pages further enhance the learning experience.
Disclaimer: This material is for general informational & educational purposes only and should not be considered investment advice or an investment recommendation. T4Trade is not responsible for any data provided by third parties referenced or hyperlinked, in this communication.


