Technical indicators are undoubtedly a valuable tool in managing forex trades. They offer several benefits to traders looking to maximise their profits. They can help identify trends, provide signals, reduce risk, support fundamental analysis, and improve decision-making. However, it is important to remember that no single indicator can provide all the information needed to make successful trades. Traders should use technical indicators in combination with other tools and strategies to maximise their chances of success.
In the first 3 articles of our technical indicators series, we looked at some of the frequently used indicators used by traders worldwide. In this 4th and final article of the series, we’ll examine another 5 technical indicators to add to your toolkit.

Moving Average Envelopes technical indicator
This indicator is a popular charting tool used in technical analysis to identify potential buy and sell signals in the financial markets. It is a trend-following indicator that is based on moving averages. The Envelopes indicator is constructed by creating two parallel lines around a moving average. These lines are usually drawn a certain percentage above and below the moving average, with the percentage often determined by the user.
The upper line of the envelope is considered a resistance level, while the lower line is considered a support level. When the price of an asset reaches the upper envelope line, it may be considered overbought and a potential sell signal. Conversely, when the price reaches the lower envelope line, it may be considered oversold and a potential buy signal.
Force index technical indicator
The Force Index developed by Alexander Elder, a well-known trader, measures the strength of a price trend by analysing the relationship between price and volume.
The Force Index is calculated by subtracting yesterday’s close from today’s close and multiplying the result by today’s volume. The resulting value is plotted as a histogram below the price chart.
A positive Force Index value indicates buyers are in control of the market, while a negative value indicates that sellers are in control. A strong positive reading suggests that the market is likely to continue rising, while a strong negative reading suggests that the market is likely to continue falling. Traders can use the Force Index in several ways, such as to confirm price trends, identify potential reversals, and generate buy and sell signals.
Fractals technical indicator
Fractals are a technical indicator used in financial trading analysis to identify trend changes (potential reversals in price trends. It is one of five indicators of the Bill Williams trading system, made up of a series of at least 5 successive bars, with the highest high in the middle and 2 lower highs on either side. In contrast, a reversing set of fractals is a series of 5 successive bars, with the lowest low in the middle, and 2 higher lows on both sides. Fractals have high and low values and appear on a chart with up and down arrows.
Fractals typically suggest that the market may be changing course. When the fractals present a pattern with the lowest low in the middle and two higher lows on either side, it suggests a bullish turning point. However, when the highest high is in the middle with two lower highs on each side, a bearish turning point is said to be occurring. Traders typically use fractals with other technical indicators to make trading decisions.

Gator Oscillator technical indicator
The Gator Oscillator is a technical analysis indicator developed by Bill Williams to help traders identify trends in the market and determine entry and exit points. It is a histogram-based indicator that measures the difference between the Alligator’s jaw and teeth (blue and red lines) and displays it in a histogram format.
The Alligator indicator is a combination of three moving averages, which are the Alligator’s jaw (blue line), teeth (red line), and lips (green line). The jaw represents a 13-period simple moving average (SMA) shifted 8 bars into the future, the teeth represent an 8-period SMA shifted 5 bars into the future, and the lips represent a 5-period SMA shifted 3 bars into the future.
When the Gator Oscillator is above the zero line, it indicates a bullish trend, and when it is below the zero line, it indicates a bearish trend. The wider the gap between the bars of the Gator Oscillator, the stronger the trend. Traders can use the Gator Oscillator to confirm the trend and identify potential reversal points.
Ichimoku Kinko Hyo technical indicator
Ichimoku Kinko Hyo is a technical analysis indicator developed by Japanese journalist Goichi Hosoda in the late 1930s. It is a comprehensive indicator that uses multiple moving averages to identify key support and resistance levels, trend direction, and potential trading signals.
The indicator consists of several components:
The Tenkan-sen (or conversion line)
Computed by adding the highest high and the lowest low over the previous 9 periods and dividing the result by 2.
The Kijun-sen (or baseline):
Calculated in much the same way as the Tenkan-sen but over the past 26 periods.
Senkou Span A (Leading Span A):
Here, the Tenkan-sen and Kijun-sen are added together, divided by 2, and then the result is plotted 26 periods ahead.
Senkou Span B (Leading Span B):
This is calculated is computed by adding the highest high and the lowest low over the previous 52 periods, then dividing by 2, and finally plotting the result 26 periods ahead.
Overall, the Ichimoku Kinko Hyo indicator is a popular tool among technical analysts, particularly those who trade in the forex market. However, as with any technical indicator, it should not be used in isolation but in conjunction with other technical and fundamental analysis tools to make well-informed trading decisions.

Why choose T4Trade to start trading
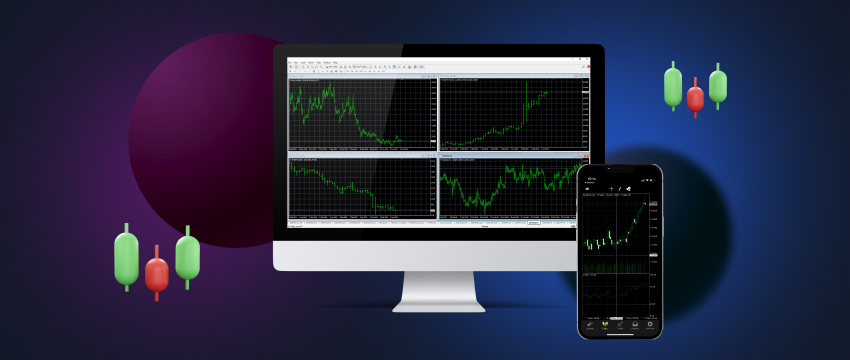
T4Trade is quickly gaining popularity among global traders, particularly for its trading expertise and MT4 innovation. T4Trade’s MT4 platform provides traders with most of the trading tools required to make strategic trading decisions. The broker is also best known for the fast execution of trades, competitive spreads, flexible trading conditions, and security of funds. It also offers access to 300+ financial instruments across 6 asset classes.
Disclaimer: This material is for general informational & educational purposes only and should not be considered investment advice or an investment recommendation. T4Trade is not responsible for any data provided by third parties referenced or hyperlinked, in this communication.


