US stock markets found a floor under their feet over the past two sessions, snapping their steep three-day losing streak and recovered some losses as the majority of top tier earnings releases enticed traders to re-enter the market for some quick taking opportunities.
In this equities report we aim to present a snapshot the latest earnings results from tech giant Microsoft and the aerospace engineer General Electric and finally conclude with a technical analysis.
Equities report
Microsoft sees pot of gold laying ahead
Yesterday in the aftermarket hours session, the tech behemoth giant Microsoft released its equities report for the third quarter of 2023. The company topped both its Earnings Per Share (EPS) and Revenue forecasts, primarily led by strong growth of its flagship cloud business, the Azure cloud services. More specifically Microsoft surpassed the revenue estimates by almost $2B ($56.5B vs $54.53B) and topped the EPS forecasts by $0.34 ($2.99 vs $2.65), recording a 12.8% rise from last quarter’s results. Currently, Microsoft is trending near the $340 range in today’s premarket session, up by almost 4% in the aftermath of the earnings equities report.
What caused the uplift in market sentiment however, were the company’s lofty projections from the executives for the upcoming quarters. Since the start of the year, the tech giant has been allocating immense capital resources on the development of its artificial intelligence unit, in attempts to make headway against its competitors in the AI race and its partnership with OpenAI, the maker of the popular AI chatbot ChatGPT appears to be on track to bear fruit. The executive team foresees that the advancements on this front would bring invaluable benefits for the company and propel it to the front of the pack.
General Electric raises eyebrows
Yesterday’s, the all-out eye-catching performance belongs to General Electric, as the company landed an impressive earnings report that led enough analysts to revise upwards their projections. The aerospace engineer topped both its Revenue and EPS targets with a notable margin, but also broadcasted that improved growth trends shall be expected going forward. More specifically the company beat its Revenue forecasts by 7% which corresponds to $1B ($16.5B vs $15.42B) and topped EPS targets by $0.26 ($0.82 vs $0.56) and the prime drivers behind the results were the solid growth and robust demand for its aerospace engine products and services, primarily for commercial purposes, but also a decent performance in its renewable energy and power division.
Lastly, the forward guidance did not disappoint since the company foresees further rises in commercial and military orders for engines in the coming quarters and improved efficiency in regards to their “green-transition” frontier, albeit its impending separation with the renewable energy and power divisions. Post the release the stock upshot and during yesterday’s session it has managed to record a 6.5% gain. Year to date, General Electric is up by a walloping 70%.
Equities التحليل الفني
#MRK Daily Chart

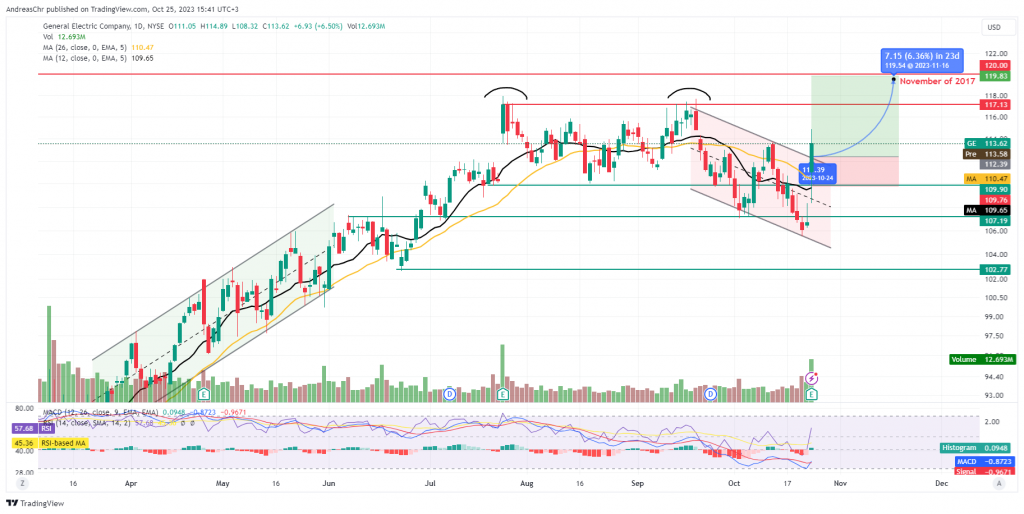
Looking at GE Daily chart we observe its share price abruptly snapping above the descending channel and temporarily severing the short-term downward movement, after the equities earnings report results surprised to the upside. We hold a bullish outlook bias for the stock given the optimistic forward outlook of the company and the break above the descending channel could be interpreted as the starting point for a possible retest of the 52-week highs formed back in September.
Supporting our case for upside move is the RSI reading below our Daily chart, which registers a value of 57, signaling bullish sentiment surrounding the stock. The furthermore the crossover of the MACD line above the signal line also validates our view for a bullish outlook, however further confirmation is needed. Should the bulls jump in and capitalize on the positive momentum, we would expect to see the stock traversing through a heavily traded area before testing for the third time the $117 (R1) resistance barrier (YTD highs).
Should the break above be successful then we set our eyes on the $120 (R2) resistance level as the next possible target, which is an area once seen before in November of 2017. Should on the other hand, the bears take over, we would expect to see GE retracing to the $110.50 (S1) support level initially and should bearish momentum accelerate, we then expect a move towards the $107 (S2) support range.
Disclaimer: This material is for general informational & educational purposes only and should not be considered investment advice or an investment recommendation. T4Trade is not responsible for any data provided by third parties referenced or hyperlinked, in this communication.


